The Future of Natural Gas - A Data-Driven Perspective
Development of a High-level Supply/Demand Framework for Natural Gas
Special thanks to Adam (@AssetTraveller) for reviewing this article and providing feedback.
In the rush towards a renewable energy future, physics fundamentals of the energy sources are often ignored. The scalability and reliability of renewable energy in the medium-term future remain subjects of debate and there are more and more signs of wind and solar technologies to underperform expectations.
Natural gas, often dubbed the 'transition fuel', plays a critical role in bridging the energy gap, ensuring energy security, and providing a viable economic alternative as we navigate the complex shift away from dirty coal (switch is associated with a 50% reduction in carbon emissions), while satisfying an ever increasing demand for energy.
Figure 1. Difference in air quality in India before (left) and during (right) Covid-19 lockdown. India relies on coal for ~55% of their energy generation (Source: The Guardian, April 2020).
In this article, I develop a high-level global supply/demand framework for natural gas and highlight the enormous economic potential of North American liquified natural gas (LNG).
Natural Gas Consumption Trends and Projections
Note: Graphs and analyses in this article were produced by myself unless noted otherwise.
World Natural Gas Consumption
To get started, let’s look at the world-wide natural gas consumption (Figure 2). From 1980-2022, the world’s natural gas consumption grew at a rate of 2201.7 MMcF (million cubic feet per day) per year representing a compounded annual growth rate (CAGR) of approximately 2.54%.
The EIA projects a slight decline in natural gas consumption rates 2023-2050 (CAGR 0.88%) as other energy sources (primarily renewables) are going to take more market share. Personally, I believe these numbers are underestimating future growth as renewables will likely fail to live up to expectations. Nevertheless, natural gas is a high growth story and will very likely remain one for the coming decades.
Figure 2. World natural gas consumption. Historical data from 1980-2022 (blue) and EIA projections from 2023-2050 (grey). Regression for historical consumption (black). (Data Source: EIA, October 2023).
As a comparison, EQT (the largest North American natural gas producers) estimates a growth rate of Non-North American natural gas demand of around 4-5 bcf/d (billion cubic feet per day equivalent to 1460-1825 MMcF/year) for the next 10 years (Figure 3). The implied CAGR for the EQT forecast runs at around 1.55%. This is almost double the EIA projection, but excludes the expected North-American demand decline but likely represents a more realistic estimate.
Figure 3. Non-North American natural gas demand forecast (Source: EQT Investor Presentation, October 2023).
U.S. Natural Gas Consumption
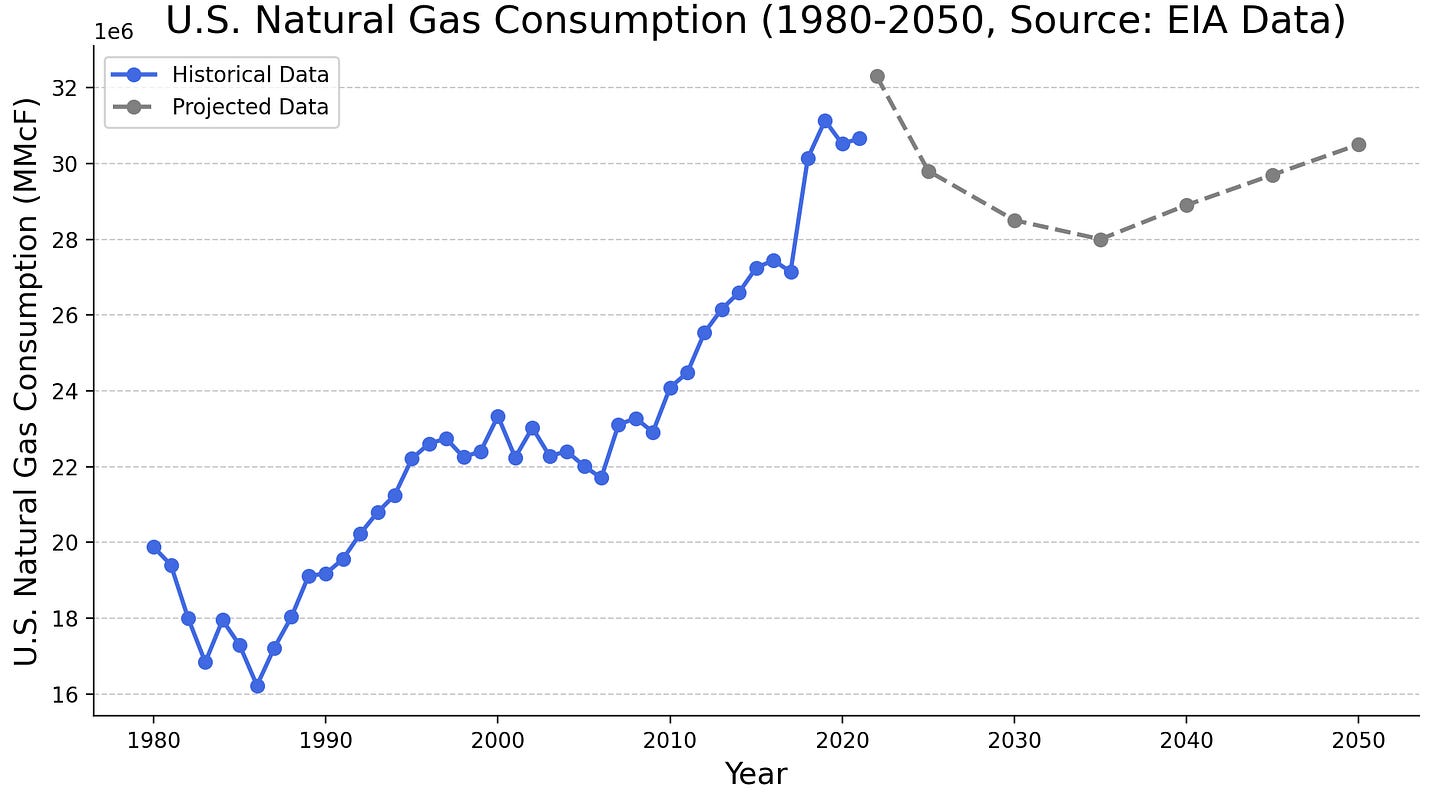
As the world demand for natural gas is increasing, let’s look at the demand-side in the U.S. (Figure 4), the world’s largest producer of natural gas. Remarkably, the EIA forecasts the U.S. natural gas consumption to peak between 2023-2025 before declining and stabilizing on an elevated level. Again, the shift towards renewable energy sources is projected to be the main driver for the forecasted decline in consumption. I remain cautious on that narrative.
Figure 4. U.S. natural gas consumption. Historical data from 1980-2022 (blue) and EIA projections from 2023-2050 (grey). (Data Source: EIA, October 2023).
It is worth to point out that “the cure for low prices is low prices”, which emphasizes the fact that a low commodity price discourages new supply and incentivizes demand. Therefore, current projections might underestimate the supply/demand imbalance going forward.
An example of incentive-driven demand increase is the coal-to-gas switching seen in Europe (Figure 5). At the currently “low” natural gas price level and high carbon prices, gas-fired energy generation becomes increasingly competitive with coal.
Figure 5. Coal-to-Gas Switching (Source: EuropeanGasHub.com, October 2023).
Natural Gas Production Trends and Projections
The World’s Top 5 Natural Gas Producing Countries
To understand the supply side of the natural gas story, we have to look at the production volumes of the largest producing nations in the world. Figure 6 shows the 2023 production levels of the top 5 producers. The U.S. is the biggest natural gas producer by a large margin, followed by geopolitically challenged countries (at least from a Western perspective): Russia, Iran and China.
Thus, the North American gas supply accounts for pretty much exactly 50% of the world’s production capacity and the primary safe source of supply for the Western world.
Figure 6. Top 5 natural gas producing nations (Data Source: GlobalFirePower.com, October 2023).
Natural Gas Production in the U.S.
The reason for the U.S. enormous production capacity is rooted in the shale revolution, which brought on sheer endless amounts of oil and gas. However, where in the U.S. is that gas produced and is the supply side still growing?
Figure 7 shows the monthly dry shale gas production by shale source. To the attentive reader, it becomes evident that the largest basins: Marcellus, Permian and Haynesville have not been growing in 2023 and have strongly slowed down production growth during the past 2 years.
Figure 7. Monthly dry shale gas production by shale source (Source: EIA, October 2023).
It is out of scope of this article to go into the details of shale reserves depletion. However I can highly recommend the research of Goehring & Rozencwajg (Market Commentary: The Gas Crisis is coming to America) and leave one quote here:
Even if we are off by 20% in our recoverable reserve estimates (which we do not think we are), the Marcellus and Haynesville peak will only be pushed out by one year. Given the declines in the rest of the shale basins and in conventional production, this will still not be enough to avoid swinging the US natural gas market from structural surplus to structural deficit.
Goehring & Rozencwajg Market Commentary, Q1 2022
U.S. Supply/Demand Model
To bring everything together, let’s focus on the U.S. and try to develop a reasonable supply/demand model. Figure 8 shows the supply/demand balance (incl. imports and exports) from 1960-2022.
As highlighted in the light grey shaded area, U.S. natural gas has been in an increasing surplus since around 2015, due to the shale revolution mentioned above. Thus, the natural gas price has been depressed at sub $4/MMBtu (million British thermal units) for most of the past decade.
Figure 8. U.S. natural gas supply/demand model (dry gas production and total consumption). LNG exports are highlighted in dark red (Data Source: EIA, October 2023).
This begs the question, why is the U.S. not exporting and selling their surplus to Europe or Asia where gas supply is challenged? In fact, they do (see Figure 8, dark red bars). However, given the gaseous phase state of the commodity, the overseas export requires the liquification of the gas into liquified natural gas (LNG).
And this is where the natural gas story becomes very interesting for investors: How fast can the U.S. (and Canada) ramp up their LNG export capacity to benefit from the enormous price differentials in Europe and Asia?
As a quick comparison (October 2023):
Henry Hub (HH): USA price $3.21/MMBtu
Title Transfer Facility (TTF): Continental Europe price $15.7/MMBtu
Japan Korea Marker (JKM): East Asian price $17.9/MMBtu
The price of gas in the U.S. trades at a 80%+ discount to Europe and Asia, representing an incredible opportunity for domestic gas exports through LNG.
More on the generational North American LNG opportunity in the next article (don’t forget to subscribe)!
Conclusion
In the evolving global energy landscape, natural gas stands out as a pivotal commodity in ensuring energy security and bridging the transition to a cleaner future, as the scalability and reliability of renewable solutions still remain questionable in the medium term.
The U.S., being the largest natural gas producer in the world, holds a unique position to capitalize on the international price disparities through LNG exports. North American LNG, thus, not only promises energy stability for regions with constrained supply but also emerges as a promising investment area. As the world is challenged with shifting energy dynamics, the role of North American natural gas will be instrumental in shaping the future.
In the next article, I will deep dive into the opportunities for investors to participate in the North American LNG markets by modeling different demand/supply scenarios based on the here established framework.
Subscribe for more deep commodity research content!


